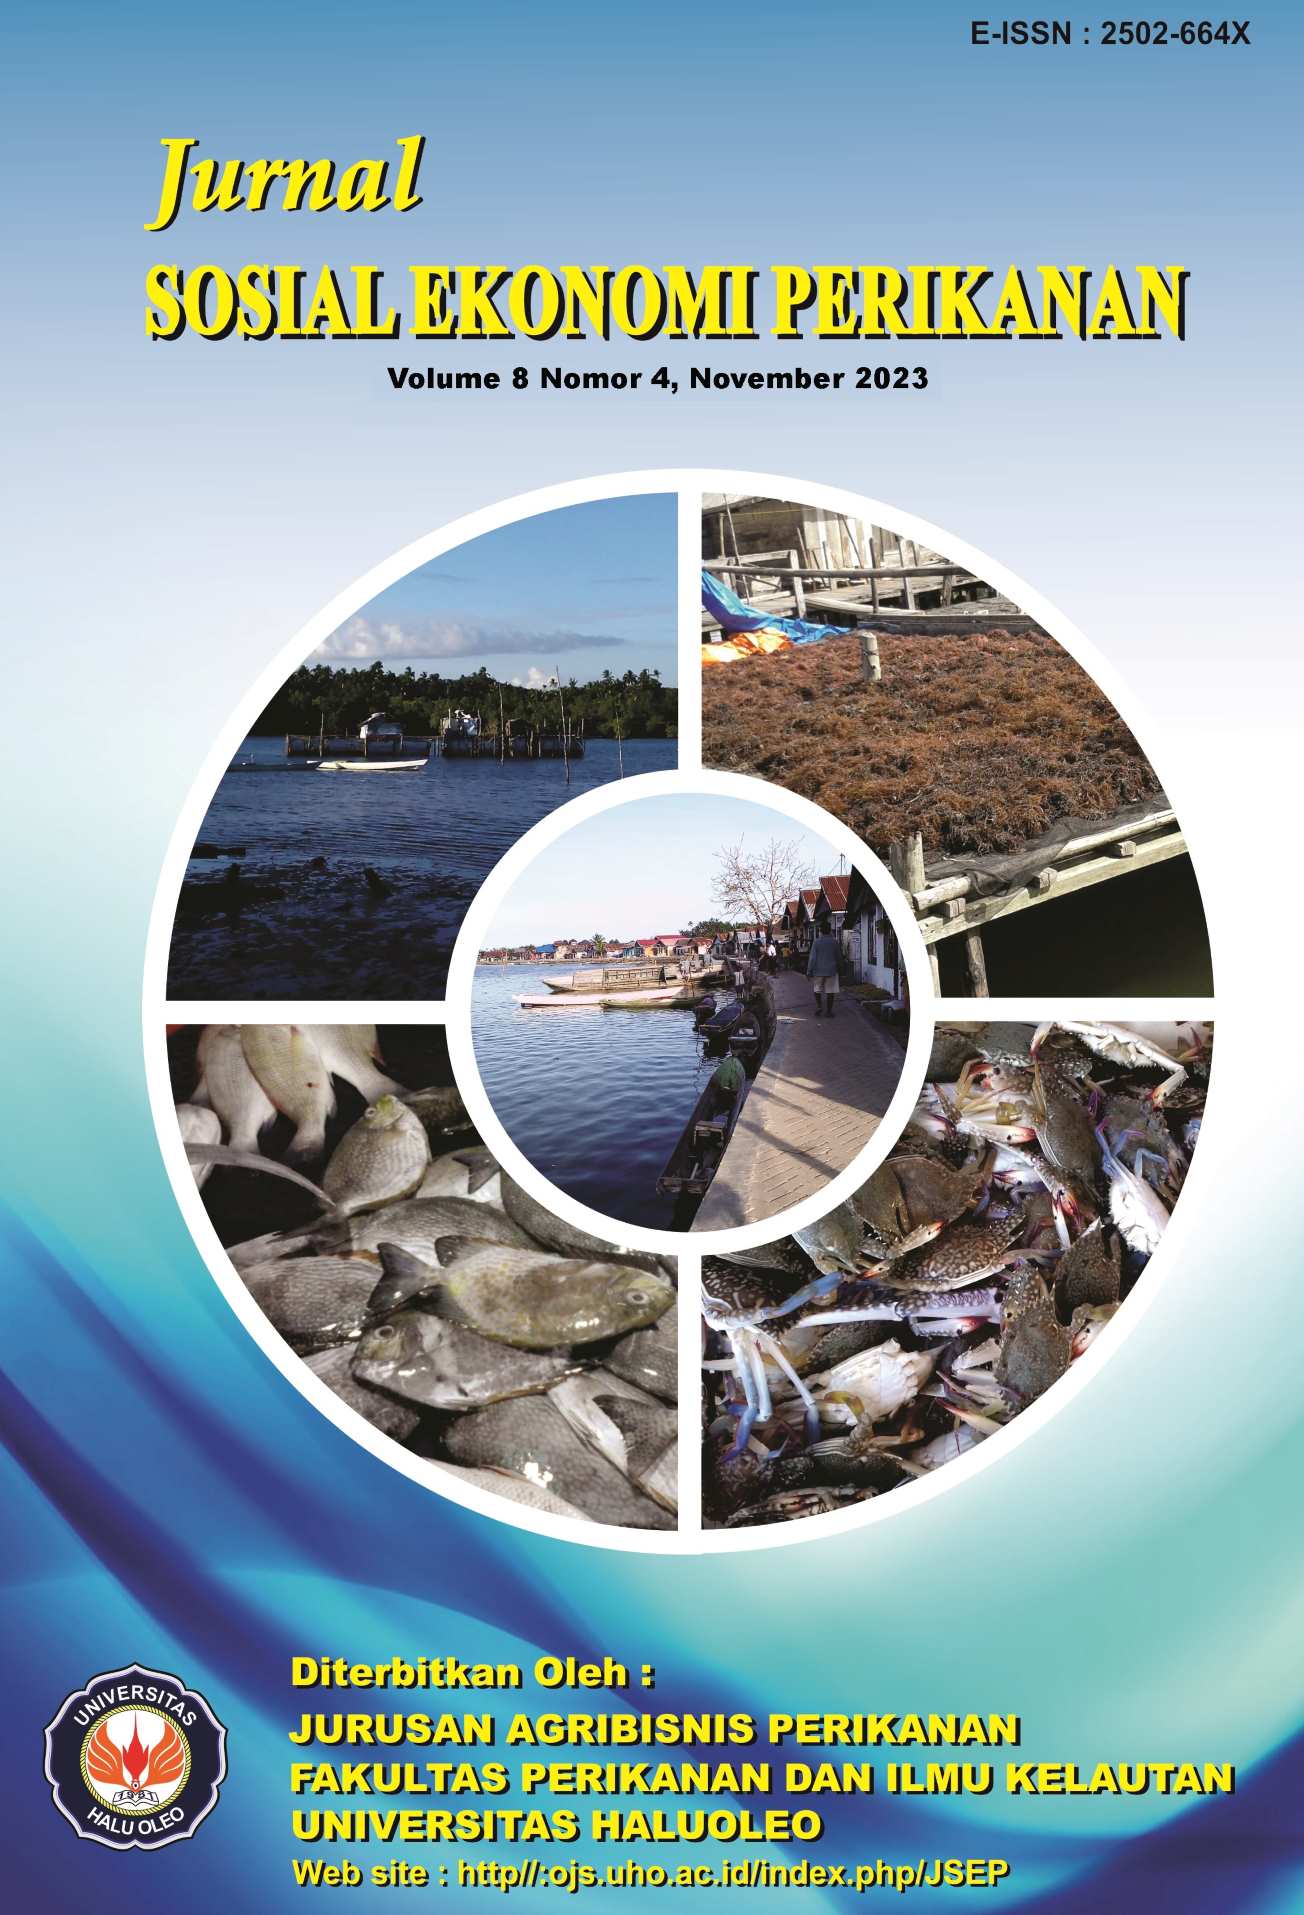
Fish consumption level in Selat Nasik District, Belitung Regency
DOI:
https://doi.org/10.33772/jsep.v8i4.59Keywords:
random sheet, economic value, regression, Nasik Strait, fish consumption levelsAbstract
The potential for fisheries in Selat Nasik sub-district is high. A total of 742 people work as main fishermen. The fish commodities found in Selat Nasik have high economic value and have even become export commodities to various countries. The Selat Nasik sub-district area has its own uniqueness, therefore researchers conducted an analysis related to the level of fish consumption. The purpose of this study was to measure the value of fish consumption levels in Selat Nasik District, Belitung Regency. The method used in the withdrawal of samples uses a random method using a random sheet. Sampling is done directly by looking for respondents in Selat Nasik Subdistrict, precisely in Selat Nasik Village and Suak Gual Village. This research was conducted in August 2023. This study uses data analysis methods, namely analysis of fish consumption levels and uses quantitative descriptive data analysis. The results of the analysis show that the level of fish consumption is 71.42 kg / capita, this result shows a high category compared to the level of fish consumption nationally. Researchers took data from the level of fish consumption in the Nasik Strait from 2020-2022 with data on the level of fish consumption in 2023. The results of the regression analysis show that the level of fish consumption in Selat Nasik District has decreased due to a slope value of -0.4713 and an intershape value of 1023.3. The decline in fish consumption levels is due to various factors such as uncertain fishing seasons and expensive fish prices. This is because fishermen erratically go to sea during high wind weather conditions so that the supply of fish is not fulfilled. In addition, there are also lock down policies that cause restrictions in the use of transportation, causing movement to be very tight or limited.
References
Arthatiani, F. Y. (2018). Analisis pola konsumsi dan permintaan ikan menurut karakteristik rumah tangga di indonesia (Doctoral dissertation, Bogor Agricultural University (IPB)).
Badan Pusat Statistik (BPS). 2022. Kecamatan Selat Nasik Dalam Angka 2022: Badan Pusat Statistik Kabupaten Belitung.
Badan Pusat Statistik (BPS). 2016. Kecamatan Selat Nasik Dalam Angka 2016: Badan Pusat Statistik Kabupaten Belitung.
Djunaidah, I. S. (2017). Tingkat konsumsi ikan di Indonesia: ironi di negeri bahari. Jurnal Penyuluhan Perikanan dan Kelautan, 11(1), 12-24.
Egayanti, Y. (2018). Peningkatan Penjaminan Keamanan dan Mutu Pangan untuk Pencegahan Stunting dan Peningkatan Mutu SDM Bangsa dalam Rangka Mencapai Tujuan Pembangunan Berkelanjutan.
Mohajan, H. (2018): Qualitative Research Methodology in Social Sciences and Related Subjects. Published in: Journal of Economic Development, Environment and People. Vol. 7 No. 1 (31 March 2018): pp. 23-48
Lenaini, I. (2021). Teknik pengambilan sampel purposive dan snowball sampling. Historis: Jurnal Kajian, Penelitian dan Pengembangan Pendidikan Sejarah, 6(1), 33-39.
Lestari, I. P., Lipoeto, N. I., & Almurdi, A. (2018). Hubungan konsumsi zat besi dengan kejadian anemia pada murid SMP Negeri 27 Padang. Jurnal Kesehatan Andalas, 6(3), 507-511.
Permen KKP Nomor 35 Tahun 2014
Tavika, H. E. S. S., & Al Masjid, A. (2022). Makanan Tradisional Masyarakat Bangka Belitung Lempah Kuning. Jurnal Dinamika Sosial Budaya, 23(2), 338-343.
Downloads
Published
How to Cite
Issue
Section
License
Copyright (c) 2023 Kurniawan, Doni Steven, Jepri Agusfianto

This work is licensed under a Creative Commons Attribution 4.0 International License.
Jurnal Sosial Ekonomi Perikanan (JSEP) dilisensikan di bawah lisensi (CC Attribution 4.0). Pengguna bebas untuk menggubah, memperbaiki, dan membuat ciptaan turunan bukan untuk kepentingan komersial, dan walau mereka harus mencantumkan kredit kepada Anda dan tidak dapat memperoleh keuntungan komersial, mereka tidak harus melisensikan ciptaan turunan dengan syarat yang sama dengan ciptaan asli.


